When you’re just starting to work with numbers, it doesn’t make sense to focus on a very large number of indicators. If you haven’t been measuring any data in your school until now, the best option is to select a few key numbers, measure them regularly, and use them for decision-making.
Three important indicators that will simply tell you how your language school is performing are: net profit margin, cost of acquisition (potential student or signed contract), and retention rate.
Summary
- The most important indicators in a language school are: net profit margin, cost of acquisition (CAC), conversion, and student retention.
- Marketing data shows which channels truly sell.
- Operational data (attendance, NPS, duration of cooperation) affect revenue stability.
- It’s worth collecting all information in one system (e.g., CRM).
- Regular data analysis in schools allows for decisions based on numbers rather than instincts.
- Even a small language school should measure data and gather information about students.
What will you find in this article?
- What indicators are worth measuring in language schools?
- Where to collect data about the language school?
- What other data should you pay attention to?
- How to utilise reports available in LangLion to support analytical activities?
- Summary – what data is worth collecting in language schools?
What indicators are worth measuring in language schools?
I. Net profit margin in a language school
In simple terms, the net profit margin shows the financial standing of the school. It allows you to see if the school is actually generating a profit.
The formula is quite simple: net profit divided by revenue, then multiplied by 100%, so the result is in percentage.
Let’s break down this indicator:
- Revenue – this is what we earn from: online language courses, in-person courses, corporate training, and educational materials that we sell.
- Costs – I think no one has a problem understanding this: these are salaries, taxes, rent for classroom spaces, and other areas that you need to purchase or pay for.
- Net profit – this is revenue minus costs.
As you can see, the formula is very simple, yet it allows you to determine a really important issue: “What is the current financial level of the school?”
II. Customer acquisition cost
It’s important to know how much it really costs to acquire a potential student and sign a contract.
This can be measured separately for a specific marketing channel from which new students are acquired, as well as overall, for all acquisition sources.
1. Total acquisition cost
Let’s illustrate this with an example.
If we sum up all marketing costs (for instance: Facebook ads, Google ads, leaflets, and other promotional activities), we can compare them with the total number of inquiries about classes and courses that have arrived at our school.
We can also check how much it costs us to sign a single contract by comparing the total costs with the number of actually signed contracts.
The total acquisition cost can be calculated per month, per quarter, or per year, depending on the period we are analyzing and how detailed the data we need.
This provides really great insights into how to determine, for example, the marketing budget for a given month, quarter, or year.
2. Cost of acquisition from individual channels
If we divide the budget we spent in a month, e.g., on Facebook ads, by the number of students acquired from that source, we will find out how much it costs us to acquire one student from that particular channel.
This way, you will find out which channel is the cheapest and which is the most expensive in terms of acquiring students and signing contracts.
3. Conversion effectiveness
The effectiveness of converting a potential student into a signed contract is very important because it shows that an increasing number of inquiries does not always ultimately translate into what is most important – contracts.
Conversion effectiveness is quite a crucial indicator and is worth calculating. In Excel, creating such a table will take very little time and will allow you to determine whether the money we spend on acquiring students actually translates into contracts.
Thanks to this, you will find out which channel:
• acquires students the best,
• results in the highest number of signed contracts.
III. Student retention rate
The student retention rate in a language school is simply information about how many students continue their studies. It is undoubtedly the best proof of the effectiveness of the classes and courses offered.
The formula is very simple:
- In the denominator, you put the number of students who started learning at the beginning of the semester,
- In the numerator, you put the number of students who want to continue learning in the next semester,
- Multiply by 100 and, of course, the result is in percentage.
A very simple example with numbers:
If at the beginning of the semester, your school had 100 students, and 80 of them enrolled in a new course, then if you divide 80 by 100 and multiply by 100%, the result will be 80%.
It’s worth measuring this all the time because if you compare the results year over year or semester over semester, it will be very helpful in planning activities for the next semester.
Where to collect data about the language school?
All information about both potential clients and current students should be collected in one place so that you can access it easily at any time.
A CRM system is primarily used to manage the contact database you have in your language school. It will definitely support our marketing, sales, and analytical activities.
It is important to remember that the entire sales process does not end at the moment of course purchase; on the contrary. That’s when managing current students and all after-sales service comes into play. CRM will facilitate these processes for you.

How does CRM support analytics?
Regarding how CRM in language schools supports analytics, primarily:
- you have a database of students and information about them in one place,
- you can plan calls and emails to them,
- you can check the history of contact with the student,
- you can check which payments have been settled, what grades they received, and how they responded in surveys.
All information regarding a specific student is visible once you access their profile. You can analyze acquisition channels, leave notes. For example, after a phone conversation about planned courses, what they are satisfied with, their preferences, etc.
You can plan contact and set it as tasks in the calendar. Of course, all complaints and feedback should also be collected there.
What other data should you pay attention to?
A language school should collect data that realistically supports sales, marketing, and retention, as well as the quality of teaching.
Therefore, it is also important to have information about attendance, learning progress, student satisfaction, length of cooperation, and details regarding groups and courses.
You can use NPS or surveys, which are very simple to implement and easy to conduct.
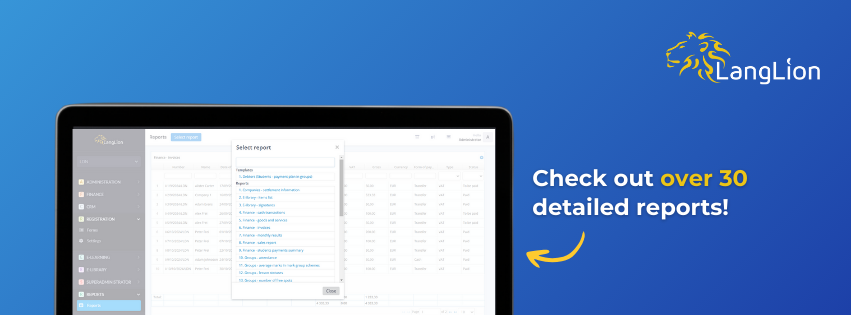
How to utilise reports available in LangLion to support analytical activities?
At LangLion, you have access to over 30 different reports. Example reports cover areas such as sales, cash flow, profitability, salaries, discount policies, and attendance.
The reports you are interested in can be downloaded monthly, quarterly, or compared year on year. Each report has its own filters, allowing you to, for instance, filter invoices for a given year by setting the date from 1st January to 31st December of that year.
Importantly: these filtering results can be saved as a template, which is very helpful because you don’t have to return to setting filters each time; you can immediately obtain ready results. Reports can be downloaded and exported.
Summary – what data is worth collecting in language schools?
A language school should collect and analyze data that directly impacts sales, marketing, retention, and the quality of teaching.
Key information includes the profitability of groups and courses, sources of student acquisition (e.g., Google Ads, social media, referrals), customer acquisition costs (CAC), conversion from inquiry to enrollment, and the effectiveness of individual campaigns.
Operational data is equally important: attendance, learning progress, satisfaction level (e.g., through NPS surveys or feedback forms), and length of cooperation. NPS), the length of cooperation, and the reasons for withdrawing from a course.
Regular analysis of these indicators allows for data-driven decision-making. In practice, the better you measure the process from the first contact to course renewal, the easier it will be to increase the revenue and stability of the language school.
If you’d like to chat about how we can help you grow your school, book a free LangLion demo!