
As the owner of a language school you know very well that when undertaking any actions (whether related to sales or marketing), you analyze them and assess the effects, even if you are not aware of that. You check students’ satisfaction, evaluate the work of the secretariat and sales results of your representatives. Now that you know a website is not just a showcase, but also a kind of virtual „sales expert”, it is time to learn how to measure the outcomes of its operations in a simple way 😉
And this is where Google Analytics comes to the rescue. This is nothing more than a free tool offered by Google, which is a system of statistics and provides the possibility to measure the traffic at our website and collect data about users. Owing to it we can determine whether the website fulfills its role, what actions bring about the best effects, and what requires a potential improvement. How is this possible? By placement at our website of a special code, which collects data about users that are of relevance for us and sends them to Google Analytics, where they are analyzed and presented in the form of reports and statistics. Then we can learn how users visiting the website behave, what attracts their attention, and what their preferences are. This helps us to tailor the website to the target group we want to reach.
What we shall start with, or merging the website with Google Analytics
This is very simple! To merge your website or blog with Analytics service, you need to have a Google account, but not necessarily Gmail. You will learn step by step how to create an account HERE.
If we already have a Google account, we create an Analytics account by logging in at the following address: https://marketingplatform.google.com/about/analytics/
How to create the account?
- Click on the button Start for free.
- Click on the button Create for free.
- This is where the entire account creation starts. We provide the account name and choose the data sharing options.
- We click on Further.
- We decide what we want to measure (network/application), in this case, it is a network, and we click on Further.
- We provide the website address, choose the industry category, time zone, and click on Create.

We accept the terms of service and we are all set! We receive the code, which we place later at the website. As concerns code’s installation, this task is better entrusted to the webmaster responsible for support of your website. He will certainly know how to place the code at your website fast and efficiently.
How to use and read the data?
When we log into Google Analytics, the first page we are going to see is the Landing Page. It is divided into two parts: the menu placed on the left and the desktop presenting individual statistics. From this place, we have access to several categories, which – after clicking on them – are going do show to us some more detailed data. Let us go through all of them one by one.
Recipients
A chart presenting user behaviors at your website from the point of view of:
- number of users – it shows to us the number of users active at your website in a given period of time,
- sessions at the website – a session is a series of user’s actions and interactions within a defined time interval. A single session may cover several page views, transactions, or social interactions. We identify two ways of the session’s end: after a lapse of 30 minutes of no activity and at midnight. One can adjust this time frame according to your own guidelines; you can learn how to do it HERE,
- bounce rate – the value expressed as a percentage, denoting the percentage of website sessions that were limited to viewing a single page/subpage,
- session’s duration – average time spent by users on the website.
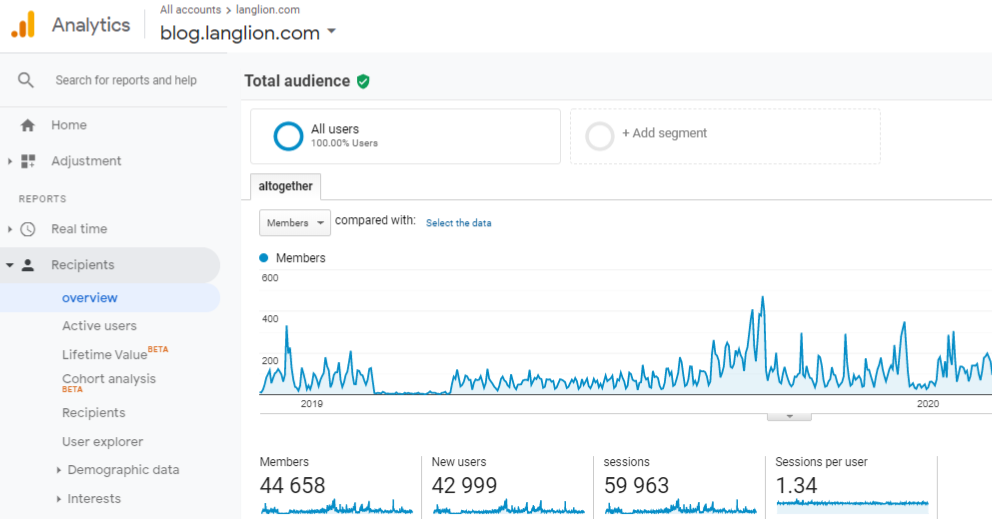
We have also an option to choose the period of time from which we want to upload data to the chart. Consequently, we can see how behaviors of your users have shaped up today, within a week, a month, three months in a specific time interval. This is extremely useful during enrollments or performance of an advertising campaign. Then you can clearly see what effects arise from our actions and when we should change the tactics.
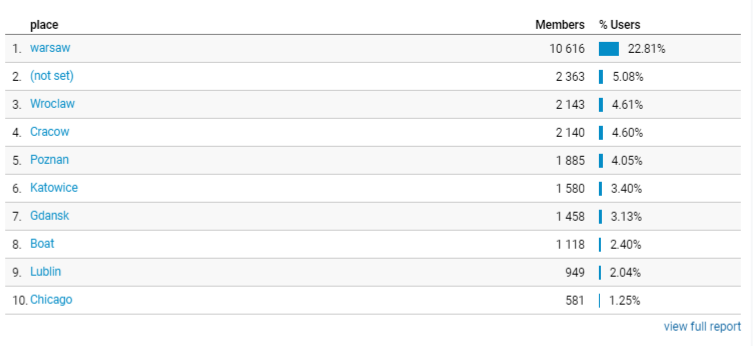
Clicking under the chart at the button „Total recipients” we can learn detailed data concerning the people visiting the website of your school. Then you will be able to determine:
- where they come from,
- how many of them are new users, and how many are regulars,
- what browser and operating system they use.
Why would you need this data? Owing to them you can check e.g. whether proper recipients reach your website. If your school is located for e.g. in Prague, and you have the greatest number of visits from Brno, this signals the fact your website is ill-positioned.
Acquisition – how the users came to visit your website
We can identify 5 basic channels generating website traffic:
- Direct – direct visits to the website, i.e. entries through the website address or saved tab.
- Organic search – entries through free search results from web browsers.
- Referral – referrals from a link placed at other pages e.g. the landing page.
- Social – here we can see the soundness of your social media, i.e. the sum of all entries from Facebook, Instagram, Twitter etc.
- Paid Search – through clicks on paid advertisements e.g. Google Adwords.
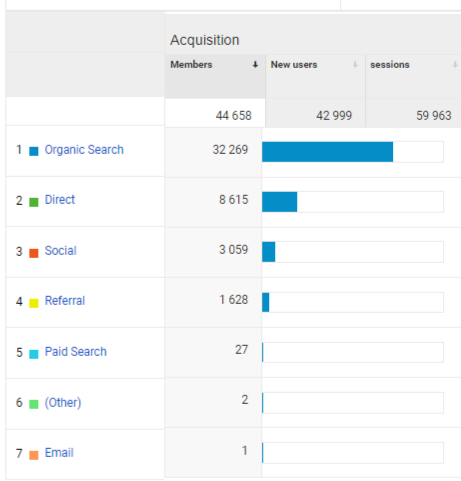
Here we can see precisely highly relevant pieces of information, such as sources of website entries or from what other pages users are referred to. Additionally, within a single channel, we can identify precise sources. For example, we can see which browser your users use most often. This allows for better positioning of the website in search results.
It is a good idea to follow the traffic coming from the Google browser. Certainly, it would be best to have website traffic generated by various sources but frankly speaking in most cases the greatest number of users come to the website through Google. If you record a sudden decline of traffic coming from the said browser, this is likely to denote errors appearing at your website or a server failure lasting for some time already. This will be a clear signal that remedial action is extremely urgent.
Users’ behaviors at the website
Owing to this tab, you are going to obtain particularly relevant pieces of information on how users behave at your website, what pages are most frequently visited, and which ones enjoy the least popularity. You receive a detailed report on how much your users are committed. You will find those pieces of information in the tab Website content – All pages.
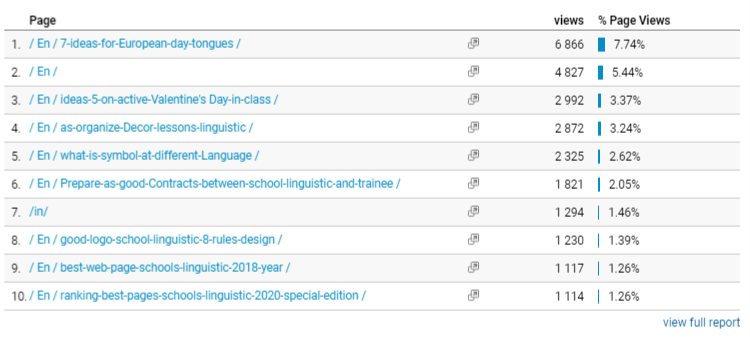
This provides a wide spectrum of knowledge, particularly during enrollment for the entire year. If you notice the tab of „Spanish courses” is frequently visited, and you still have very few people willing to enroll, this is a signal that the offer is not necessarily as tempting as we thought. Perhaps it is worthwhile to think about investing in a paid advertising campaign and see how such a solution works in your case.
Google Analytics offers a sea of possibilities we might list endlessly. We have described only the most important ones of them above, but it is already clear that Google Analytics is an absolute must-have of each language school. As you can see, these tools will tell you much more about your potential customers than other sources of information. It is worthwhile to use it because perhaps it suffices to correct a few small errors to make your website a profitable tool for soliciting more students willing to learn languages, which we cordially wish all of you.
If this article was helpful for you, please let us know. This will be a signal for us to create another one, describing in more detail the capabilities of Google Analytics.